RisicoVizier
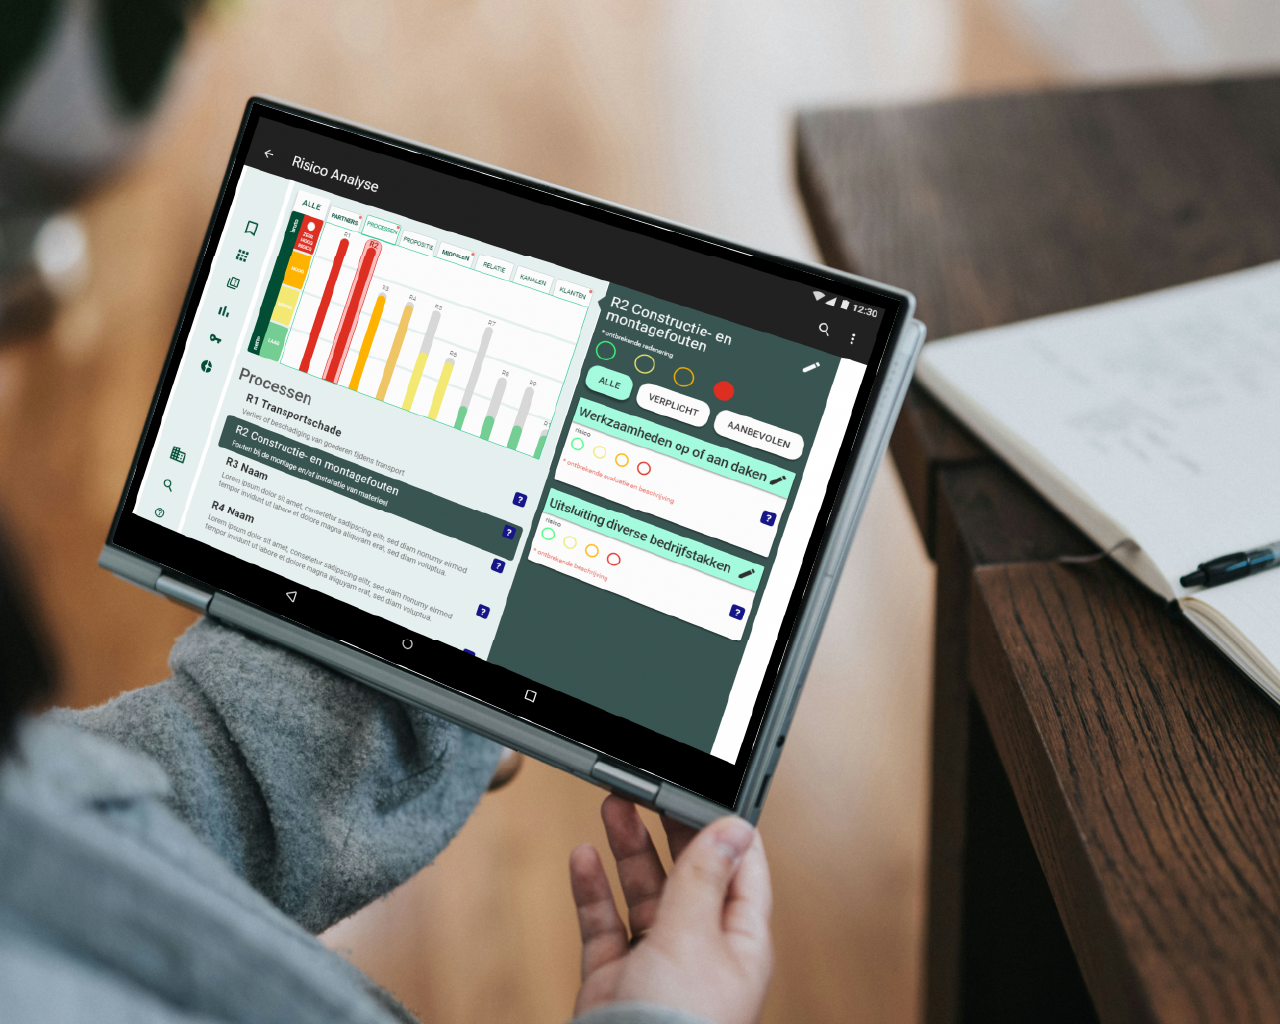
UX design for a SaaS platform to give insurance brokers a better way of conducting risk analysis and communicating to their business clients.
The Brief
SaaS platform with two phases
The platform was created to support insurance brokers to assess the risk of businesses and give advice on insurance products. It had to be composed from two phases: an analysis phase and product recommendation one. I supported the team with extensive UX research and design of the interface. Additionally, I saw through the implementation, acted as product owner for its improvement and collected data after the launch.
The Business Model Canvas approach
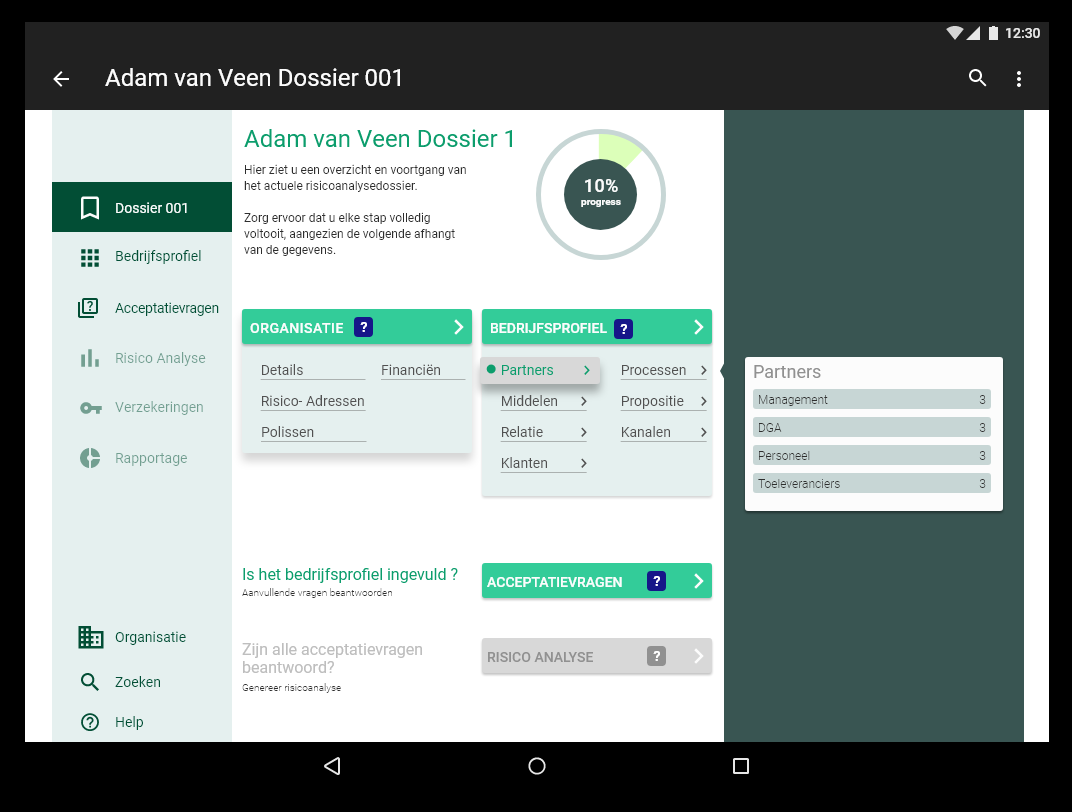
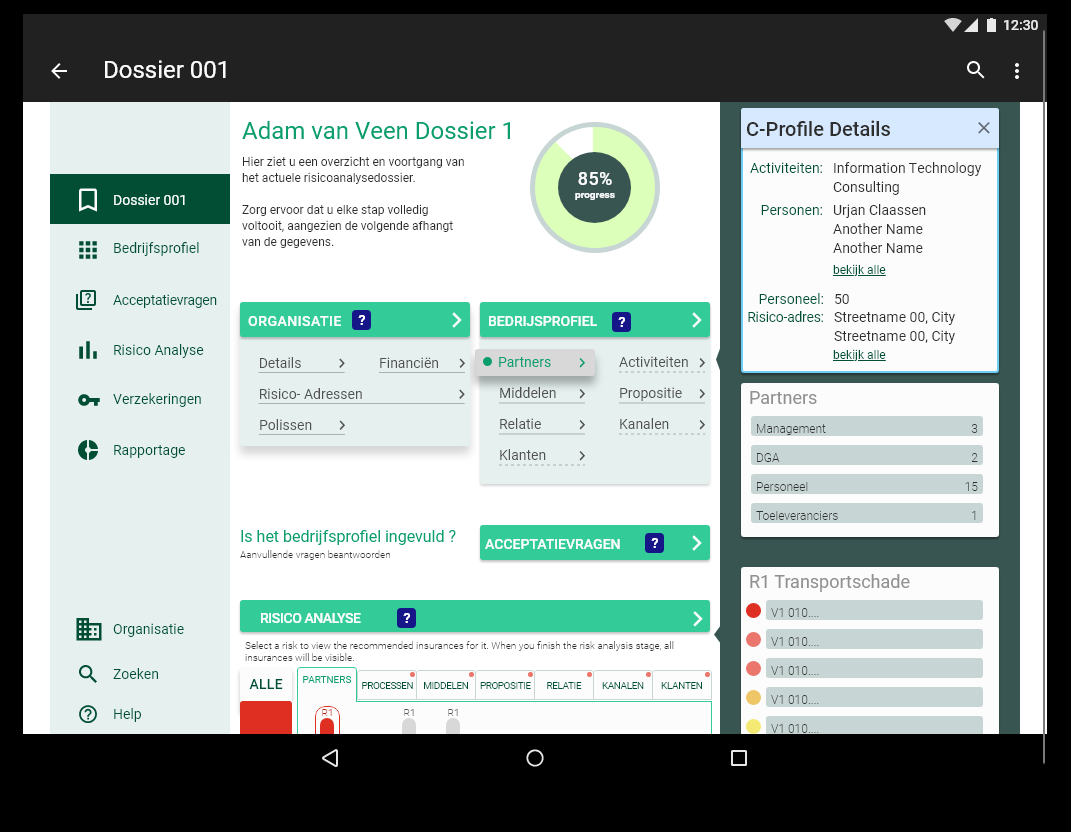
The whole methodology of the platform was based on the Business Model Canvas approach. Chiefly, the goal was to communicate the risk potential to business owners and deliver information in an actionable way. Following, this resulted in an interface which blended information about company’s management, processes and product with insurance risk prevention.
Progressive exposure
Insurance providers require collecting copious amounts of data about their clients. That depends on the business they analyze. Thus, the interface interaction of the platform was based on a progressive exposure approach. That allowed for gathering specific data at the right time of the process.
The final results
SaaS web-based platform ready to support communication between broker and business clients
With the platform brokers could
- Add all data about a client’s business and separate them in business-focused categories
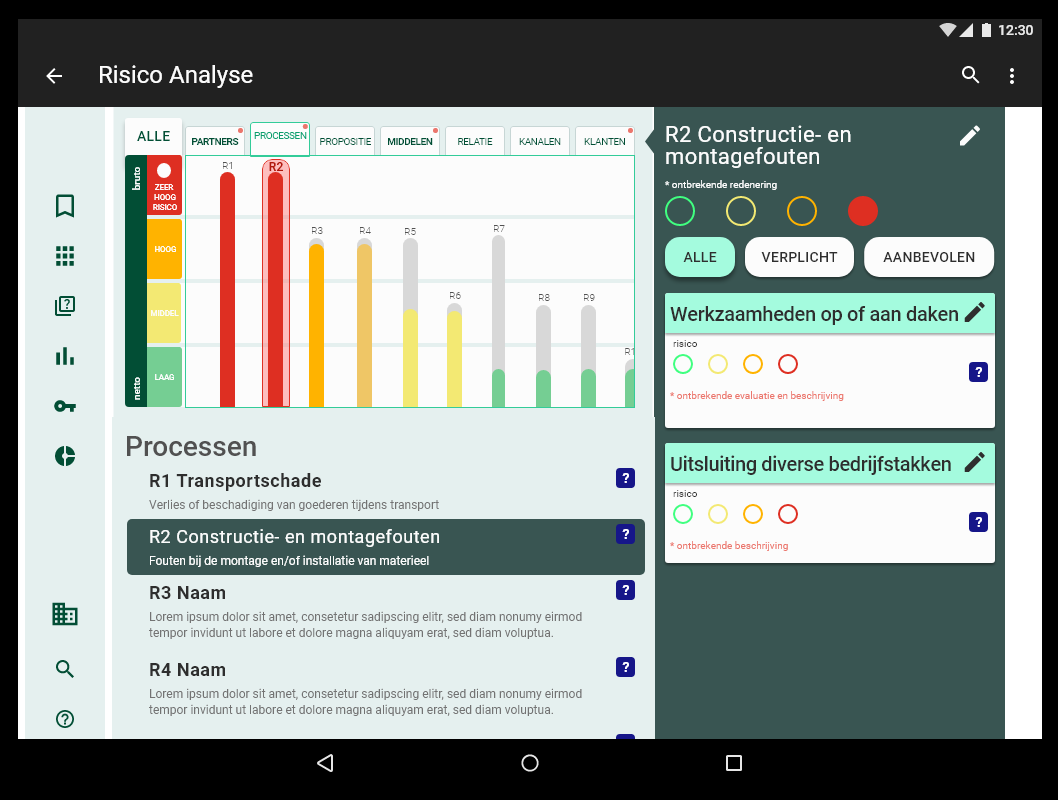
- Generate a risk score outlining all critical, high-risk and low-risk points
- Based on that, receive a list of recommended insurance products specific to the client’s needs without any unnecessary coverage.
With the platform clients could
- Receive an overview of their business and qualified advice on prioritized risk management
- Receive a report (pdf) from the conducted analysis with action points of improvement
- Receive a recommendation on insurance products for both basic and intense risk prevention
How to manage a data collection process in a prolonged time frame?
The Methodology
This was a project based on a speculation that insurance brokers and their business clients had difficulty communicating about assets and their risk management. Explicitly, that was a result of different vocabularies used in the insurance and various business fields. As a result, advisors need to pile sometimes insane amounts of data which would lead to advice for insurance coverage of every business asset. Evidently, that experience for clients was less than satisfactory.
Methods used
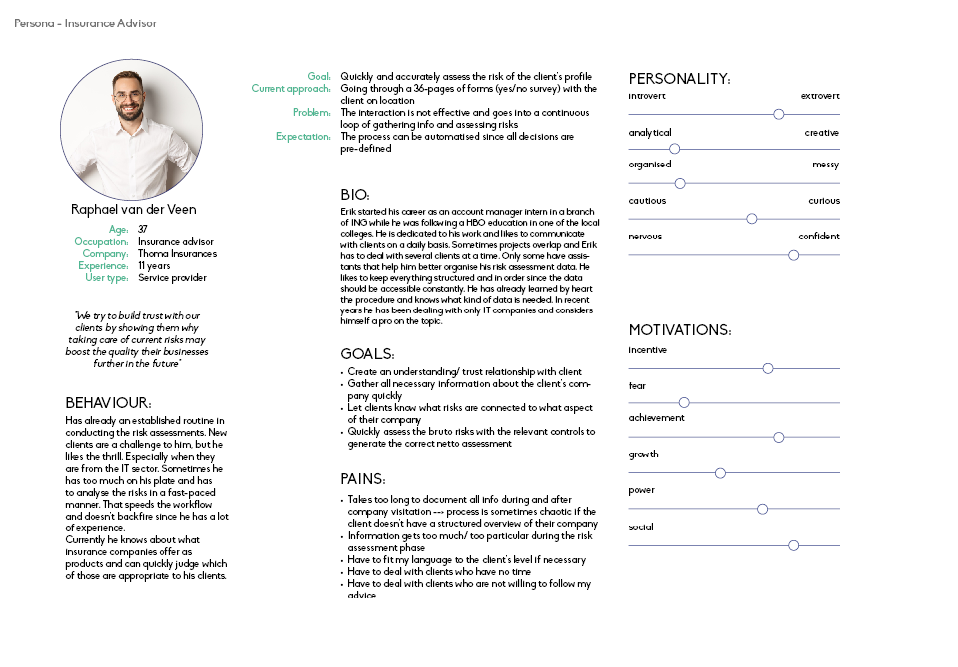
The Process
Synthesizing business and insurance communication into actionable steps
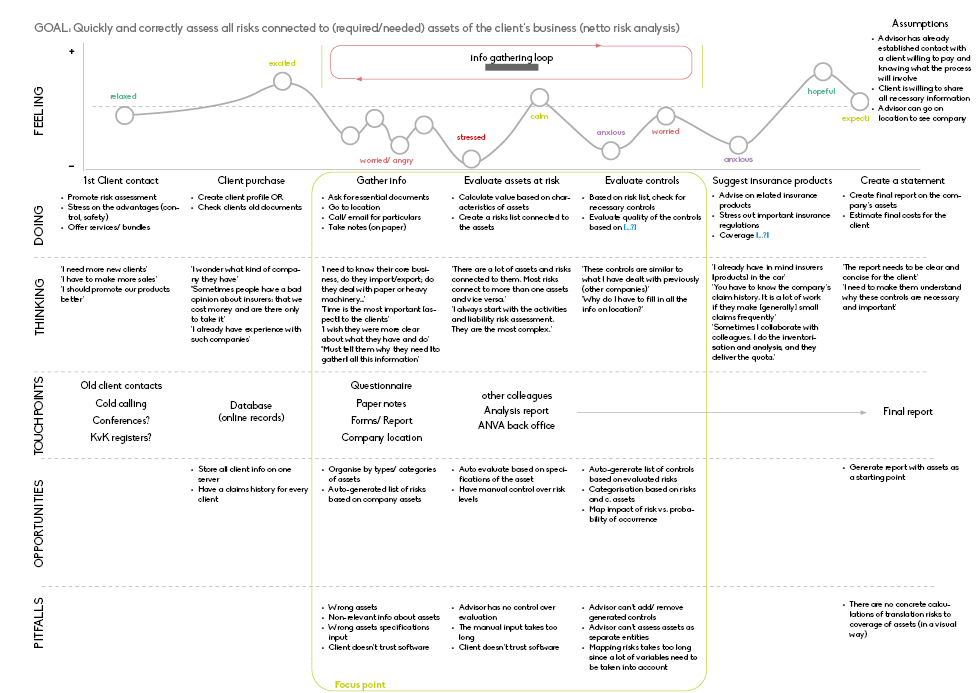
First and foremost, that steps needed to be stripped down to their core necessities. I observed how advisors in the Netherlands would go into meetings with clients and collect data. Either in an office, on site (ex. factory setting) or through document exchange.
I made surveys to discover their primary challenges and what solutions do they implement. Consequently, all the information I gathered was presented in a User Journey map (see below). The initial design drafts help me with creating low-fidelity usability tests and card-sorting established which terms and jargon was best suited for both target groups simultaneously.
The Design System
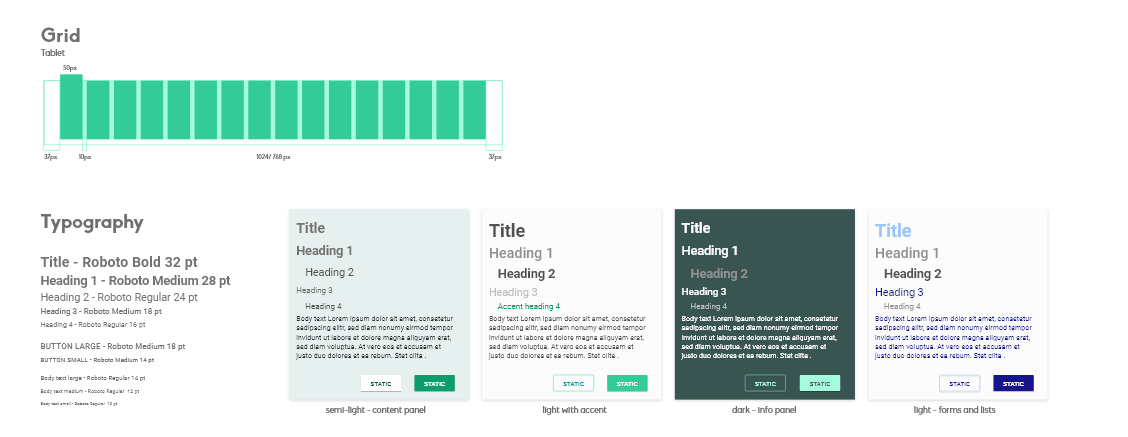
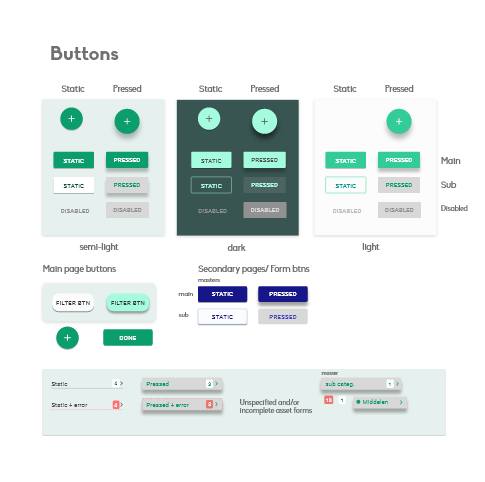
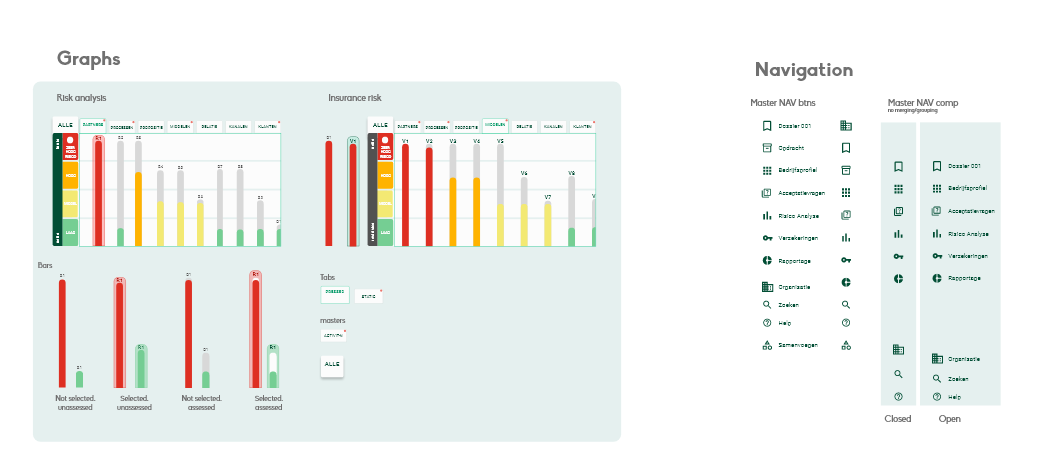
The design system was partially based on the Google design patterns. I added extra elements to distinguish topic-specific functionality. Examples are the form buttons which were only present on the form popups and categories for the Business Model Canvas boards.
